Factorysense Crane Simulation
Overview
Application
  • Usable in any industry
  • Investigation of charging areas, teeming bays, or stock yards
  • Scenarios simulation to determine the number of required cranes
  • Calculation of crane trajectories in 3 dimensions (x-, y- and z-axis)
  • Feasibility check for production schedules
  • Definition of material flow as a consequence of crane capacity
Optimization
  • Automatic Crane Scheduling
  • Assignment of transport orders to crane bridges
  • Calculate movements for collission avoidance
  • Optimization based on mixed integer and linear programming solvers
Advanced Visualization
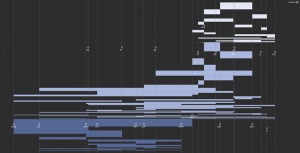
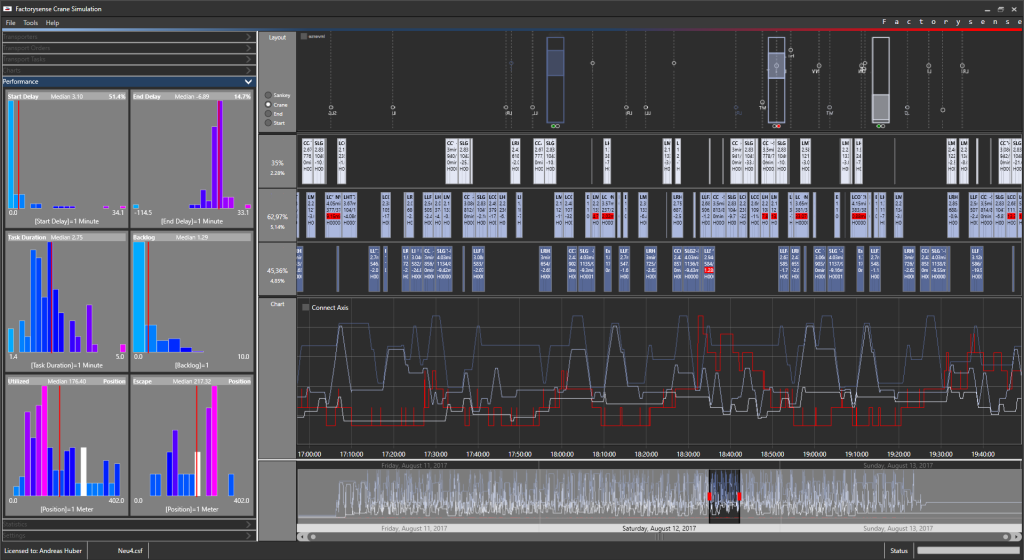
  • Gantt chart to visualize transports of specific crane bridges over time
  • Interactive rendering of crane, bridge, and trolley position in a scaled layout
  • Sankey-diagram for evaluation of material flow
  • Charts to provide information about the crane position and order backlog over time
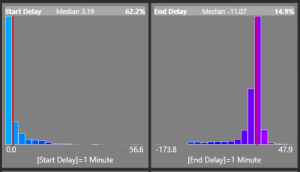
  • Interactive histograms to visualize statistical distributions of key performance indicators
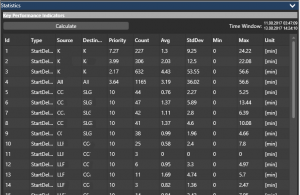
  • Analysis grid for key performance indicators
Connectivity
  • Import of Transport orders from csv files i.e. created with spreadsheet applications (Microsoft Excel, …)
  • File interface to import data directly from Factorysense Steel Control
  • Export of Factorysense 4D transport segments, for purposes of 3D visualization
Features
Crane Position Diagrams
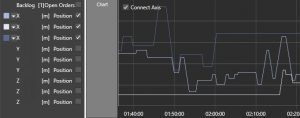
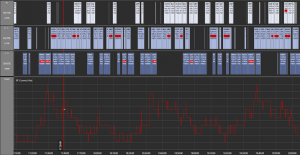
Crane positions are calculated in three dimensions and visualized in position over time graphs for each crane.
Crane Panel

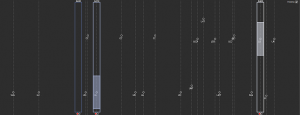
The crane positions are shown in an interactive crane panel presenting crane movements over time dependend on the mouse position on a chart.
Transport Order Backlog

The transport order backlog is indicating how many orders are waiting for execution at a given point in time. The backlog is visualized as graph over time.
Delay Diagrams

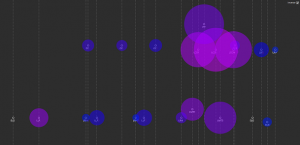
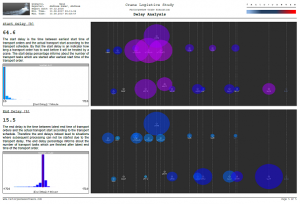
Colored areas indicate the transport order start delays or end delays. Various delay key performance indicators are indicated by size and color.
Sankey Diagram

A sankey diagram shows the number of transports fufilled between two positions. Crane assignments are shown using colors.
Key Performance Indicators

Steel plant specific key performance indicators are calculated in order to allow comparison of different scenarios. Interactive histograms are used to represent key performance indicators.
Statistics Grid

Statistical parameters such as minimum and maximum values, as well as averages and standard deviations are calculated for various key performance indicators.
Automatic Scenario Reports

Factorysense Crane Simulation allows to easily export standardized PDF reports for a scenario. The automatic report export feature is an enabler for considerable time savings in an iterative study process. The output can be used as study documentation or presentation slides. At the same time constantly high report quality can be achieved, no matter who is preparing documentation.